From Fragmented Data to a Foundation for AI
Happen Technologies helped a growing wealth management firm turn 20–30 disconnected systems into a single, trusted data foundation — and earned the trust to help redesign how the whole firm operates.

Happen Technologies helped a growing wealth management firm turn 20–30 disconnected systems into a single, trusted data foundation — and earned the trust to help redesign how the whole firm operates.
A U.S.-based wealth management firm managing investment, individual retirement, and employer-sponsored retirement plan assets relied on 20+ disconnected platforms — a custodial system, a portfolio and billing platform, a heavily customized CRM, and a multi-entity accounting system spanning multiple legal entities.
Leadership's strategic planning depended on a spreadsheet manually refreshed weekly by pulling 50–80 individual data points from across the organization. Core financial metrics were then difficult to calculate consistently depending on who pulled them and from where. Rather than piecing together another dashboard, Happen Technologies was brought in to build a true data foundation.

Data scattered across 20–30 systems, with no single source of truth or shared historical record.
A manual, weekly reporting cycles — someone had to physically collect 50–80 data points from across the organization to keep leadership's planning spreadsheet current.
Inconsistent financial metric definitions — figures like EBITDA and net operating income were not guaranteed to match depending on who calculated them.
No test environments in several core vendor systems, so validation had to happen carefully before controlled production deployment.
Built a centralized AWS + Snowflake data lake, unifying five core business systems via automated daily extraction.
Captured daily historical snapshots of key entities — a retrospective capability none of the source systems offered natively.
Ran a structured metric reconciliation process with operations leadership before automating the client-facing data.
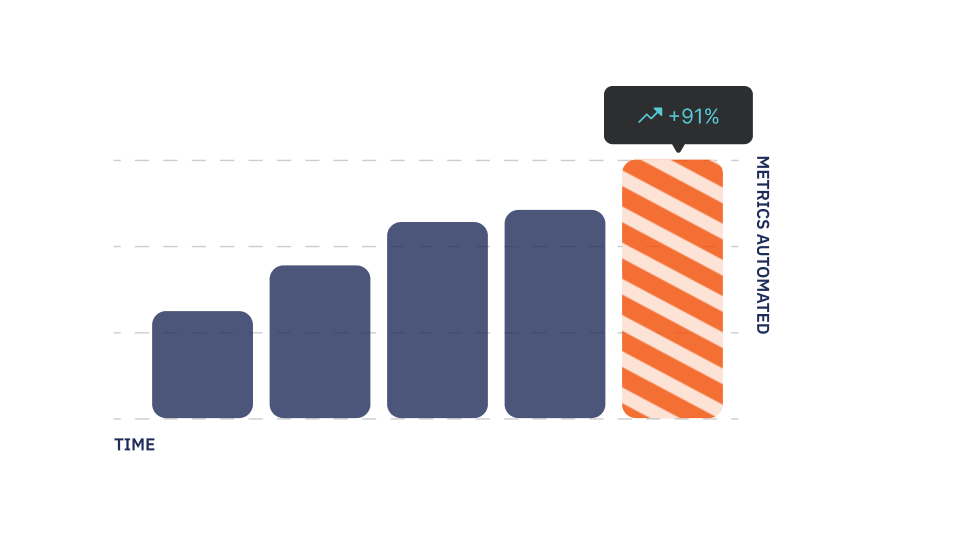
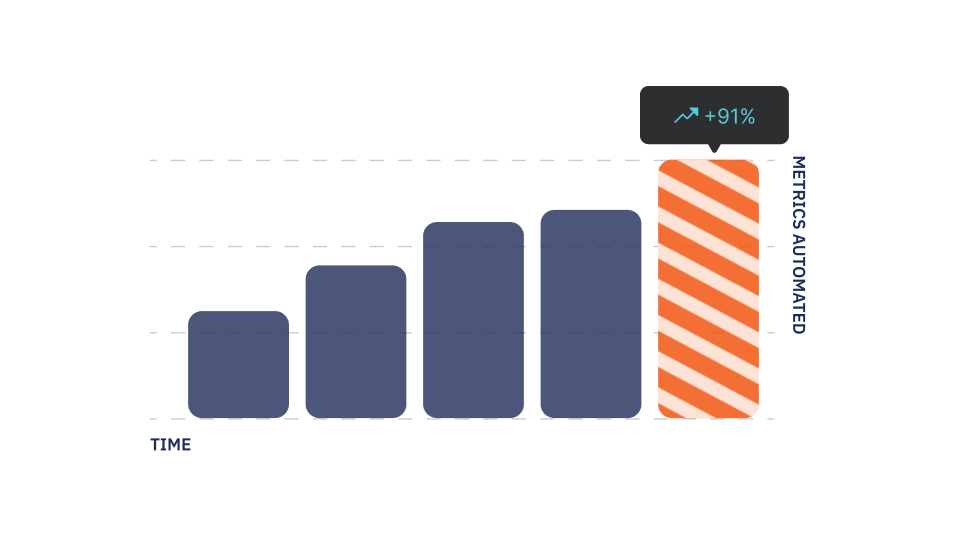
Delivered an AI-powered automated pipeline replacing static spreadsheets with live, validated data, daily.
Our engagement began with a focused effort to unify the firm's fragmented data landscape. As the foundation solidified, the scope expanded — first into metric definition and validation to make the data trustworthy, then into automation and delivery, and most recently into a much larger initiative spanning firm-wide process standardization.
We began by mapping the client’s full data ecosystem across five core business systems and defining a scalable extraction and storage approach.
Outcome: a scalable, production-ready data architecture blueprint.
With the architecture defined, we built automated daily pipelines and a centralized Snowflake data lake.
Outcome: a centralized, structured data lake with cross-system relationships and daily historical snapshots — a retrospective capability none of the source systems offered natively.
The hardest problem wasn’t access to data — it was agreeing on what the numbers should mean.
Outcome: agreed, documented calculation logic the client’s leadership team could finally trust.
Once metrics were validated, we replaced static spreadsheets with a live, automated feed.
Outcome: dynamic, always-current reporting — and a significant reduction in manual effort for the teams who used to maintain it by hand.
A reliable data foundation gave leadership the confidence to bring us into a much larger conversation about how the firm operates.
Ongoing: this phase is active, expanding the partnership from a data project into a firm-wide transformation initiative.
The current result is a data foundation the client’s leadership team now trusts and builds on. Manual weekly data-discussions have been replaced by automated daily pipelines, drawing from a single governed data lake. Financial metrics that once varied depending on who calculated them now follow agreed, documented logic — and the platform’s reliability was strong enough proof that the client recently expanded the relationship into a much larger, firm-wide initiative.
A dashboard is only as trustworthy as the numbers behind it — and this client already had a dashboard-shaped problem: a manually maintained spreadsheet nobody fully trusted, because the same metric could come out differently depending on who calculated it. Building a polished reporting layer on top of that would have just made the inconsistency look more official, not fixed it. So the order mattered: agree on what each number means and prove it's correct, then automate it. It's slower to point to in the first few months, but it's the difference between a dashboard leadership glances at and one they actually make decisions from.
Several of the client's core vendor systems simply didn't offer a safe space to test changes before they went live — a real constraint, not just an inconvenience, on a project where mistakes could touch live financial data. Our approach was to shift the safety net earlier: validating every computation internally, side-by-side against the manually-calculated numbers operations already trusted, before anything touched production. Changes were deployed carefully and in coordination with the client's own team, so the absence of a sandbox became a reason to be more rigorous about validation — not a reason to move slower on delivering value.
The data platform work earned trust the same way good infrastructure always does — quietly, by being reliable. Once the client's leadership team could see their numbers refresh automatically, match across systems, and hold up under scrutiny, the conversation naturally shifted from "can we trust this data" to "what else could we fix this way." That shift in confidence is what opened the door to a much larger, firm-wide initiative — one focused on standardizing processes and workflows across the whole operation, not just the data layer. It's also proof of a principle we carried through both phases: solid infrastructure work, done right, tends to earn the next, bigger mandate rather than staying scoped to its original ticket.

We use cookies to personalize content and ads, to provide social media features and to analyze our site traffic. We may also share information on site use with our social media, advertising and analytics partners who may combine it with other information that you’ve provided to them or that they’ve collected from your use of their services.